MODEL PORTFOLIO RESULTS:
Growth Portfolio
12/31/2002 to 2/4/2024
Growth Portfolio ————— 1,292%
S&P 500 Index ———————-440%
Compounded Yearly Returns
Growth Portfolio —————–61.5%
Dow Industrials ——————20.9%
Note: Yearly compounded return
ORIGINAL PUBLISHED RESEARCH RESULTS
The original research on the S&P 500 stocks for the years 1990 through 1998 was first made available to the academic community through Dr. Joseph Belmonte’s Doctoral Dissertation in 2002 and then to the investment community through his book entitled Buffett and Beyond published in 2004 under his penname of Dr. J.B. Farwell. This first edition was so successful that the second edition of Buffett and Beyond was published in 2015 by Wiley Publishing.
Please be aware that when Return on Equity (ROE) is used in any of our material, it is NOT the Traditional Accounting ROE, but rather the Clean Surplus ROE. Please see the link “What is Clean Surplus.”
ALL TEST PERIODS
Below are the portfolio results of the first of three, 4-year test periods. Each of the results shown include fourteen portfolios all of which had an average portfolio Clean Surplus ROE greater than the average Clean Surplus ROE of all the S&P 500 stocks in the test. In other words, they are portfolios with above-average ROEs.
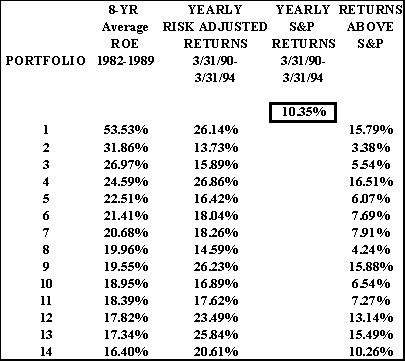
RESULTS: FIRST TEST PERIOD
Each individual portfolio’s average ROE (the average of the ROEs of all the stocks in each portfolio) from 1982 through 1989 is followed by the risk-adjusted average per year return for the following 4 years.
The S&P returned 10.35% per year during this 4-year time frame. Every one of the portfolios with above average ROEs outperformed the S&P 500 Index for the 4 year period of 3/31/1990 through 3/31/1994.
MODEL PORTFOLIO RESULTS
Model Portfolio Results
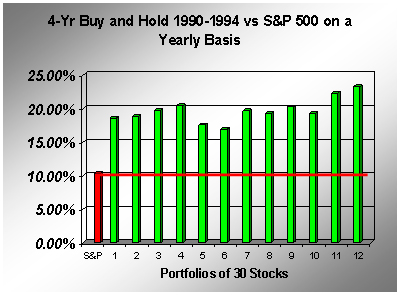
Chart Results
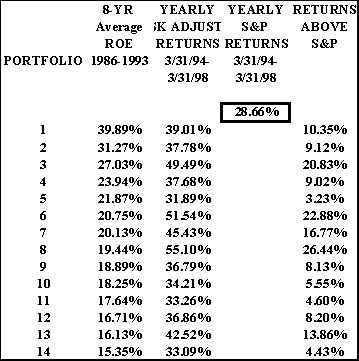
RESULTS OF THE SECOND TEST PERIOD
The results of the second test period are below. Each portfolio’s 8-year average ROE from 1986 through 1993 is followed by the risk-adjusted average per year return of March end 1994 through March end 1998.
The S&P returned 28.66% per year during this time frame. Every one of the portfolios with above average ROEs outperformed the S&P 500 for the period 3/31/1994 through 3/31/1998.
Model Portfolio Results
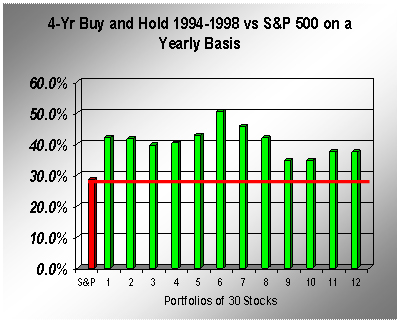
Chart Results
RESULTS: THIRD TEST PERIOD
The results during this bear market are the same as the first two test periods. Every 10-stock portfolio with above average Clean Surplus ROEs outperformed the market averages over the following 4-year time periods.
All Portfolios with above average ROEs outperformed the S&P 500 Index for the period 12/31/1998 through 12/31/2002.

Model Portfolio Results
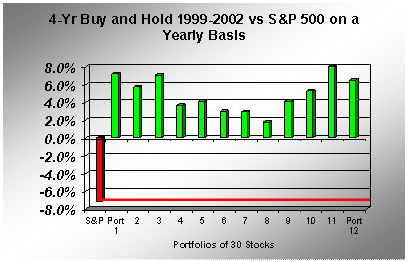
Chart Results
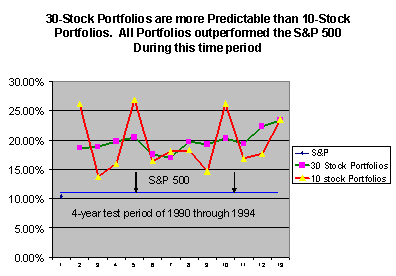
BENEFITS OF LARGER PORTFOLIOS: MUCH GREATER PREDICTABILITY (AND SAFETY) OVER ALL TIME PERIODS
The chart below shows the first 4-year test period. However, all the test periods result in the same chart formation. In every case, portfolios constructed of 30 stocks are much more predictable (in their total returns) than portfolios of just 10 stocks. However, in both portfolio sizes, 10 stocks and 30 stocks, all portfolios outperformed the S&P 500 index over all test periods.
The meaning of this is extraordinary. As an example, if a portfolio of 30 stocks exhibits an average ROE of 25%, we would expect an 80% chance that this portfolio will return approximately 20% (25% x 80%) in an average year when the S&P returns 12%.
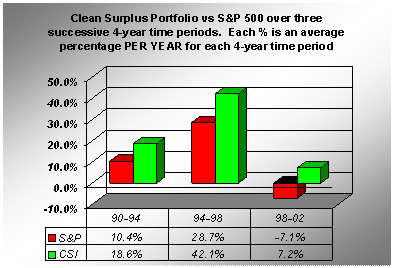
This chart to the left is a culmination of four, 4-year test periods 3 of which were shown above. The percentages you see, such as 1990-1993 show the Clean Surplus portfolio exceeding the S&P 500 index by and average of 18.6% – 10.4% or 8.2% PER YEAR for each of the 4 years that the portfolio was held.
SUMMARY: THE FINAL TEST RESULTS
The results of all test periods as well as the up-to-date research in the very beginning of this link, shows that every portfolio which was predicted to outperform the S&P index did indeed do so whether the holding period was a one year (recent research) or a four year holding period. These results indicate that Clean Surplus does indeed exhibit PREDICTABILITY and portfolios with a high and consistent Clean Surplus Return on Equity outperform portfolios with lower and inconsistent ROEs.